The Economic Crystal Ball: The Yield Curve
Financial news anchors love to talk about the yield curve with a tone of deep gravitas. They speak of its twists, its flattening, and its dreaded inversions as if they are reading ancient runes. It sounds like high-level economic jargon meant only for Wall Street power players.
In reality, the yield curve is just a simple chart. However, it happens to be one of the most accurate economic crystal balls ever discovered. Understanding how it works gives you a direct look into what the smartest financial minds on earth expect the future to hold.
What is the Yield Curve?
To understand the curve, you have to look at US government bonds, specifically Treasury bonds. When you buy a Treasury bond, you are lending money to the government. In exchange, they promise to pay you back with interest over a set period of time.
The government borrows money for all kinds of timelines, ranging from one month to thirty years. The interest rate on these loans is called the yield.
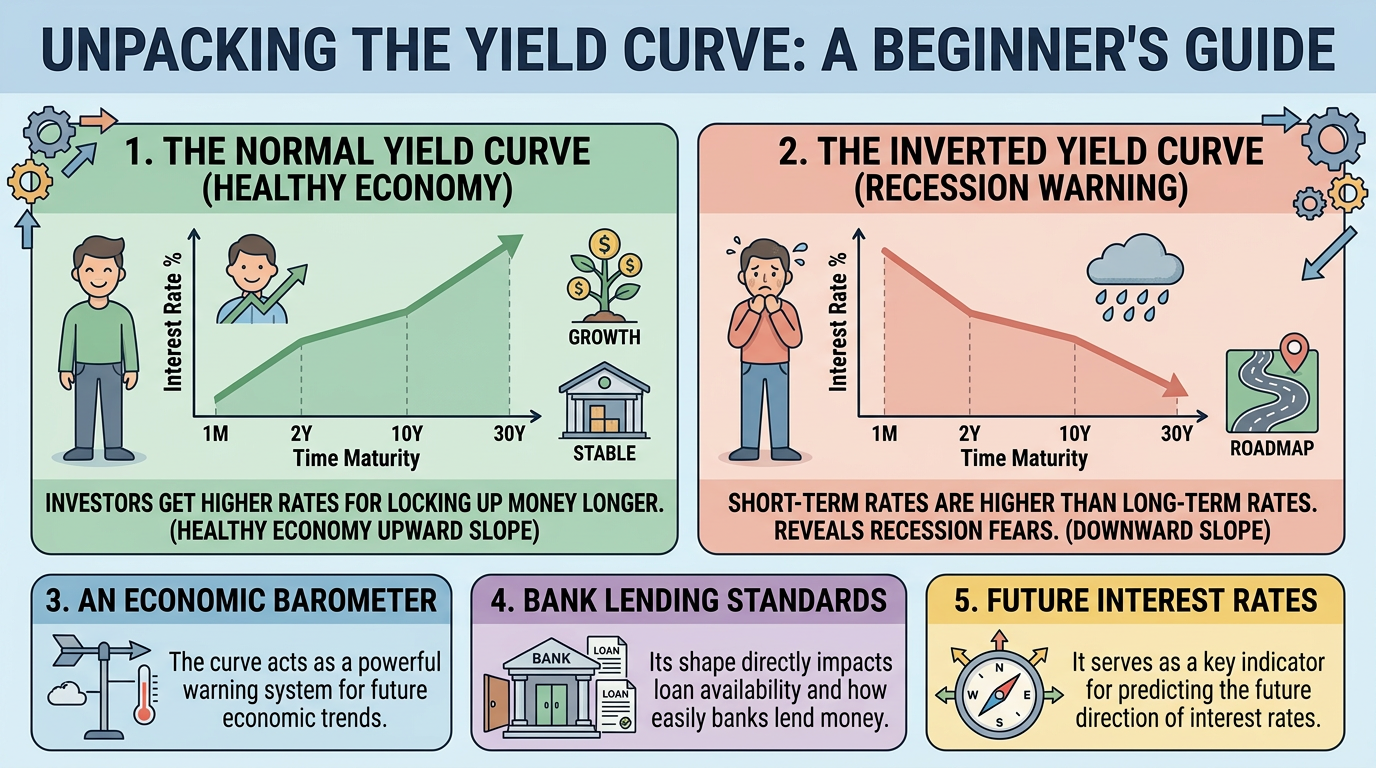
The yield curve is simply a graph that plots these interest rates. The bottom axis shows the timeline of the bonds, from short-term to long-term. The vertical axis shows the interest rate. When you draw a line connecting the dots from the short-term rates to the long-term rates, you get the yield curve.
The Normal Yield Curve
In a healthy, growing economy, the yield curve slopes upward from left to right. This is called a normal yield curve.
An upward slope makes perfect intuitive sense because time equals risk. If you lend money to the government for just three months, there is a very low chance of anything catastrophic happening to your money. Because the risk is low, you accept a low interest rate.
If you lock your money away for thirty years, you are taking on a massive amount of risk. A lot can change in three decades. Inflation could skyrocket and destroy the purchasing power of your money, or the economy could experience severe disruptions. To compensate you for taking on that thirty-year risk, the government has to offer you a much higher interest rate.
The Inverted Yield Curve
Sometimes, the financial world turns completely upside down. This happens when short-term bonds start paying higher interest rates than long-term bonds. When you plot this on a graph, the line slopes downward. This is known as an inverted yield curve.
An inverted curve seems mathematically broken. Why would anyone accept a lower interest rate for a thirty-year bond than a two-year bond?
It all comes down to fear and expectation. When big institutional investors look at the horizon and see a major economic slowdown or a recession coming, they panic. They realize that in a recession, the Federal Reserve will likely slash interest rates to stimulate the economy.
To protect themselves, investors rush to lock in today's long-term interest rates before they disappear. This massive wave of buying drives the price of long-term bonds up and forces their yields down. At the same time, investors abandon short-term bonds, forcing short-term yields up.
An inverted yield curve is a clear warning sign. It means the biggest players in the market are betting heavily that the economic future looks much worse than the present. Historically, an inverted yield curve has predicted almost every single modern recession.
Why It Matters to You
Even if you never buy a single government bond in your life, the shape of the yield curve impacts your daily financial reality in several critical ways:
Loan Availability: A normal curve allows banks to borrow cash at cheap short-term rates and lend it out via long-term mortgages. An inverted curve chokes this profit model, causing banks to tighten lending standards and make loans harder to get.
Economic Warning: Because an inverted curve has historically predicted almost every modern recession, it serves as a practical cue for everyday people to pay off debt and build up emergency savings.
Interest Rate Direction: The curve tells you where the market thinks interest rates are headed, helping you decide whether to lock in a fixed-rate loan now or wait for rates to drop in the future.
Summary
The yield curve is a simple line graph connecting the interest rates of short-term and long-term government bonds. A normal upward-sloping curve indicates a healthy economy where investors demand higher payouts for long-term risks. An inverted downward-sloping curve reveals deep market anxiety, showing that investors expect a recession and are rushing to lock in long-term safety. By keeping an eye on the shape of this curve, you can see exactly when the global financial machine is preparing for smooth sailing or bracing for a storm.
