Open any investing forum and you will find two conversations about the same stock. One is about profit margins, debt and whether the new CEO is any good. The other is about a chart with lines on it, and phrases like "it bounced off support again." Those are fundamental analysis and technical analysis. Here is what each one asks, and what the research says.
The Two Questions Being Asked
Fundamental analysis asks: what is this business worth?
Technical analysis asks: what is this price likely to do next?
Almost everything follows from that difference. A fundamental analyst can correctly judge that a company is worth $80 a share. The stock can still fall to $40 first. A technical trader can correctly call a three-week slide in an excellent company's stock. Neither result proves the other person wrong. They were never answering the same question.
That is why the argument between the two camps goes nowhere. "Charts are astrology" and "the business is already in the price" are not really contradicting each other. One is a claim about long-run value. The other is a claim about short-run movement.
What Fundamental Analysis Looks At
A fundamental analyst treats a share as a small piece of a real business, so the work is understanding it. Four kinds of input go in.
The financial statements come first: the income statement (revenue and profit), the balance sheet (what is owned and owed) and the cash flow statement. Then industry position, meaning whether the company can raise prices without losing customers to a rival. Then management, judged by what they did with money before and whether past promises came true. Then the wider economy, since interest rates and consumer demand move earnings without the company doing anything.
Out of that comes an estimate of intrinsic value: what the business is worth based on the cash it will produce, ignoring today's quoted price. Say you expect a company to produce $200 million a year for its owners. You judge that stream worth twelve times one year of it, so $2.4 billion. Across 100 million shares, that is $24 each. At $17 the analyst calls the stock undervalued and buys, expecting price to move toward value. Price-to-earnings is a faster shortcut for the same comparison.
The Problem With "Eventually"
The core claim is that price converges to intrinsic value eventually. That last word carries a lot of weight.
It comes with no schedule. A stock you value at $24 can sit at $17 for years, drift down to $12, and get there in year six or never. While you wait, being early looks exactly like being wrong.
The estimate is fragile too. Value calculations rest on assumptions about growth and about the return you demand. Small changes move the answer a long way. Take that same $200 million and assume it grows 4% a year forever, while you demand a 9% annual return. A standard formula divides $200 million by the gap between them, 0.05, giving $4 billion. Now change the growth assumption to 6%. The divisor becomes 0.03 and the value jumps to about $6.7 billion. Two percentage points of guesswork moved the answer by two thirds.
What Technical Analysis Looks At
Technical analysis sets the company aside. It studies two things: price history and volume, meaning how many shares changed hands.
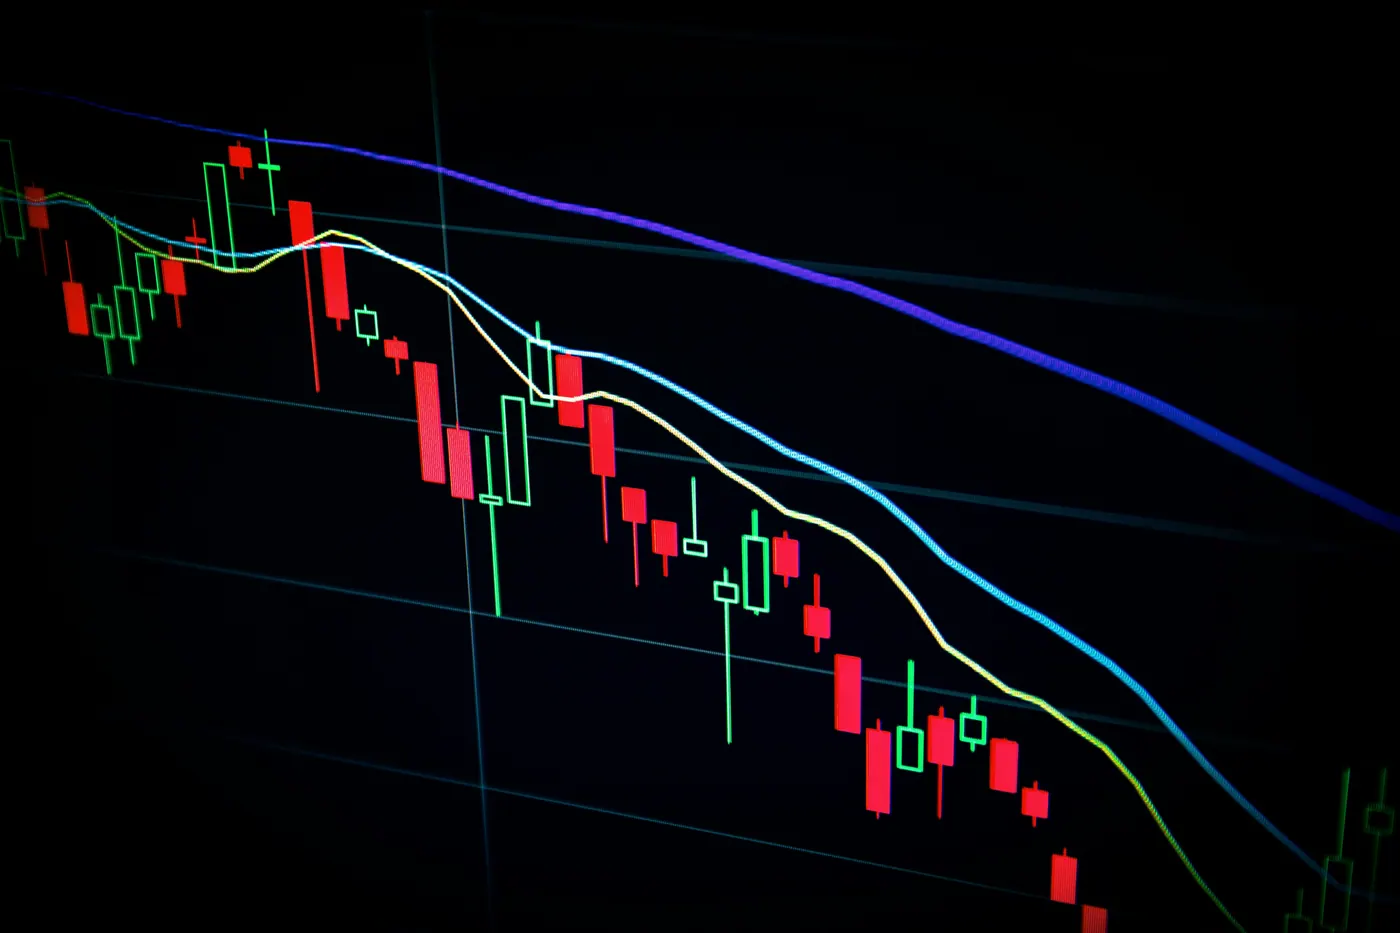
Practitioners watch trend, the general direction prices have been moving, on the reasoning that a direction in motion tends to persist. They mark support and resistance, price levels where buying or selling has stopped a move before. They use moving averages, the average closing price over a window such as 50 or 200 days, which smooths daily noise into a line. And they read volume as confirmation. A move made on heavy trading suggests more conviction than the same move on a quiet day.
The reasoning has two planks. Price already reflects everything known about the company, so studying the company again adds nothing the chart lacks. And markets are made of people, who respond to fear and greed in repeating ways. Those responses should leave repeating shapes in the data.
What the Evidence Actually Says
Both cheerleading and mockery are easy to find here. Neither is accurate.
The record on classic chart patterns is mixed and hard to read. A 2007 academic review counted 95 modern studies of technical trading rules: 56 positive, 20 negative, 19 mixed. The same reviewers explained why those counts are hard to trust. Test thousands of rules against one price history and some will look brilliant by luck alone. That problem is called data snooping. A 1999 study ran a very large number of trading rules over a century of Dow data, correcting for how many were tried. Apparent edges shrink sharply once you count the rules tested.
Momentum has held up better than pattern reading. A 1993 study found that stocks which outperformed over the previous three to twelve months tended to keep outperforming over the next three to twelve. The result has been repeated across countries, asset classes and later periods. Momentum is now treated as a recognized factor rather than a curiosity. It is still not free money. It suffers occasional violent reversals, and published returns are usually measured before trading costs and taxes.
Self-fulfilling behavior is a real mechanism, and worth understanding. When enough traders watch the same level, orders pile up there. The level then starts to matter whether or not the theory behind it was sound. Research on currency markets found exactly that: stop-loss and take-profit orders clustered heavily at round numbers, which helps explain why those levels acted like support and resistance. Crowding cuts both ways, though. A level everyone watches is also a level where stop orders are stacked, waiting to be triggered.
The Efficient Market Hypothesis in Plain Words
Both methods run into the same challenge. The efficient market hypothesis says prices already reflect available information, because thousands of people compete to act on anything new. Beating the market with that information should therefore be very hard.
It comes in three strengths.
The weak form says prices already reflect all past price and volume data. If it holds, technical analysis cannot work, because past price and volume is its only input.
The semi-strong form says prices reflect all public information, financial statements and news included. If it holds, fundamental analysis on public filings cannot reliably beat the market either. Everyone else has read them too.
The strong form says prices reflect everything, private information included. Almost nobody defends that literally. Insider trading laws exist partly because private information is clearly worth something.
Treat the three as a spectrum, not a verdict. Evidence supports the semi-strong form roughly but not perfectly, and momentum is one of the standing exceptions to the weak form.
Why Your Time Horizon Decides Which Question Matters
Neither method is required to invest sensibly. Someone who puts $200 into a broad index fund every month for thirty years is using neither, and is not skipping a step.
A question only matters if you will act on the answer. Plan to hold for thirty years, and what the price does next month has no bearing on your outcome. Technical analysis is answering a question you never asked. Plan to close a position by Friday, and the company's ten-year earnings power has no bearing either. You will be gone long before it shows up.
Short horizons also carry costs that are not debatable. More trades mean more spread and fees paid. In the US, a gain on shares held a year or less is taxed at ordinary income rates, not the lower long-term rate. Those costs are certain. Whatever edge is meant to pay for them is not.
So the first decision is not which method to study. It is how long you intend to hold, because that is what settles which of the two questions is even about your money.