One stock trades at $30. Another trades at $300. Which one is expensive?
The question cannot be answered. A share price on its own means nothing, since a company can split its stock and turn one $300 share into ten $30 shares without changing the business at all. Price becomes meaningful only next to what you get for the money.
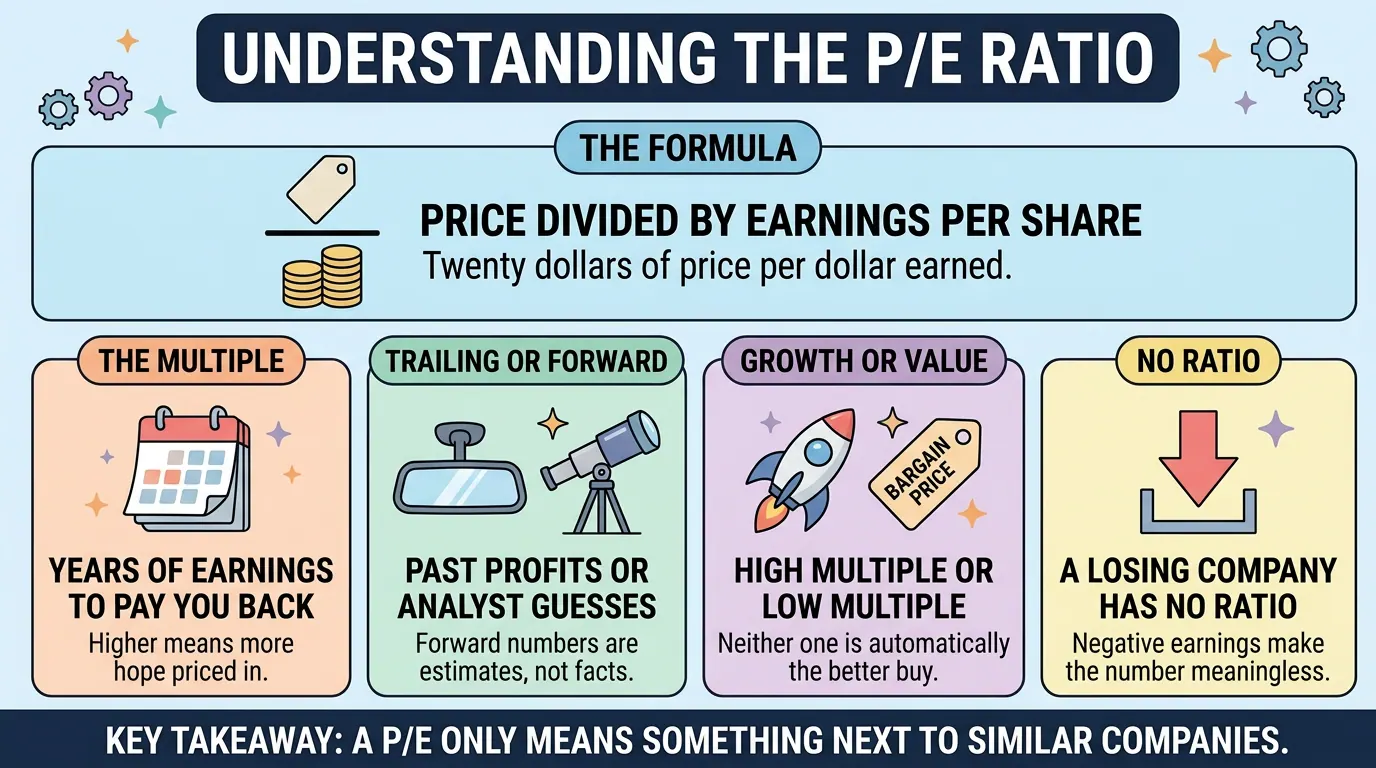
The price-to-earnings ratio is the oldest way to make that comparison. Price on top, profit on the bottom, and the result tells you what investors are paying per dollar the company earns.
Earnings Per Share
Start with the bottom of the fraction, where the substance is. Earnings per share, or EPS, is net income (profit after all expenses, interest, and taxes) divided by shares outstanding. A company earning $500 million with 100 million shares has an EPS of $5, so each share is entitled to $5 of that year's profit whether or not any is paid out.
Basic EPS counts shares that exist now. Diluted EPS also counts shares that could appear from employee stock options and convertible bonds, which makes it the more conservative figure and the one most financial sites use.
Calculating the Ratio
The P/E ratio is share price divided by earnings per share. The company above, with $5 of EPS, has a P/E of 15 at $75 and a P/E of 30 at $150, where investors pay twice as much for the same stream of profit.
Now go back to the opening. If the $30 stock earns $1 a share, its P/E is 30. If the $300 stock earns $20 a share, its P/E is 15. The cheap-looking stock is the pricier one.
What a Multiple Actually Means
People say a stock trades at 15 times earnings, or has a multiple of 15. At a P/E of 15, you are paying 15 years of current profit for one share. If earnings stayed frozen forever and every dollar went to shareholders, getting your money back would take 15 years. A P/E of 40 means 40 years.
Both assumptions are false, which is the point. Earnings do not stay frozen, and most profit is reinvested rather than paid out. A company growing profits 25% a year pays you back far faster than the flat-earnings math suggests, which is why the market lets it trade higher.
Trailing Versus Forward
Every stock has two P/E ratios in circulation.
Trailing P/E uses earnings already reported over the last four quarters, often labeled TTM for trailing twelve months. It is a fact about a year that is over.
Forward P/E uses the average of analyst estimates for the next twelve months. It is more relevant to what you are buying, and it is a guess.
Forward P/E is almost always the lower number. Analysts usually project growth, which enlarges the denominator, and their estimates as a group start optimistic and get revised down as the year goes on. A forward P/E that looks reasonable can quietly become an expensive trailing P/E.
The Number Means Nothing Alone
A P/E of 12 is not cheap and a P/E of 45 is not expensive. Those words need a reference point, and two matter.
The first is the industry. Regulated utilities have slow, dependable earnings and trade in the low-to-mid teens, while software companies with high margins and fast growth routinely trade at three or four times that. A bank at 11 and a software firm at 40 can both be fairly priced.
The second is the company's own history. If a business averaged a P/E near 18 for a decade and now sits at 30, something changed: either the market expects much faster growth, or enthusiasm has outrun the business. The bare number 30 raises no question at all.
Growth and Value
The P/E ratio is the line most often drawn between two investing styles. Growth investors buy fast-expanding companies and accept high multiples, betting earnings will grow into the price. Value investors hunt low multiples, betting the market has underrated a decent business.
The PEG ratio, popularized by fund manager Peter Lynch, divides the P/E by the expected annual earnings growth rate. A P/E of 30 with 30% growth gives a PEG of 1.0. A P/E of 15 with 5% growth gives a PEG of 3.0, arguably the more expensive stock despite the lower P/E. PEG rests on a forecast that may be wrong, but it shows why a high multiple is not automatically a bad deal.
When There Is No P/E
Divide by a negative number and the ratio stops working. A company losing money produces a negative P/E that cannot be ranked sensibly against positive ones, so most screeners just print N/A.
That is common among newly public companies, biotech firms still in trials, and any business deliberately spending ahead of revenue. It does not mean the company is worthless, only that this tool has nothing to say, so analysts fall back on price-to-sales, which compares market cap to revenue. A near-zero denominator distorts the other way, letting a company that barely scraped a profit post a P/E in the hundreds.
The S&P 500 Over Time
The same math applies to a whole index. Across roughly 150 years of data, the S&P 500's trailing P/E has had a median near 15, with single digits in the depressed market of the early 1980s, erratic readings through the 1930s as collapsing earnings distorted the ratio, above 30 at the dot-com peak, and around 30 in August 2026.
One episode exposes the ratio's biggest weakness. In 2009, at the bottom of the financial crisis, the index P/E briefly spiked past 100. Stocks were not expensive. Corporate earnings had collapsed to almost nothing, so the denominator fell faster than the price, and the ratio read as expensive at close to the best buying opportunity in a generation.
The cyclically adjusted P/E, or CAPE, addresses that by dividing price by average inflation-adjusted earnings over the prior ten years, smoothing booms and busts together.
What the Ratio Cannot See
Earnings are an accounting output, not a fact of nature. Management has real discretion over when revenue is recognized and what counts as a one-time charge. Many companies also report adjusted earnings next to the official GAAP figure, excluding items they call unusual, some of which recur every year.
The ratio also ignores debt, because market capitalization counts only the shares. Picture two companies with identical earnings and identical P/E ratios, one holding $10 billion in cash and no debt, the other carrying $30 billion in loans. They are not equally priced, since buying the second means taking on those obligations. Analysts often switch to enterprise value divided by EBITDA, because enterprise value adds debt and subtracts cash.
Cyclical industries such as automakers and airlines carry a specific trap. Their earnings peak at the top of an economic cycle, driving the P/E to its lowest reading right before profits fall. There, a low P/E is a warning rather than a bargain.
Summary
The P/E ratio is share price divided by earnings per share, measuring how many years of current profit investors are paying for. Trailing P/E uses reported results, forward P/E uses estimates that lean optimistic, and neither means anything until compared with the company's industry and its own history. High multiples price in expected growth, low multiples can signal a bargain or a cycle about to turn, and negative earnings make the ratio unusable. Since earnings bend to accounting choices and the ratio ignores debt, P/E is a starting question rather than an answer.