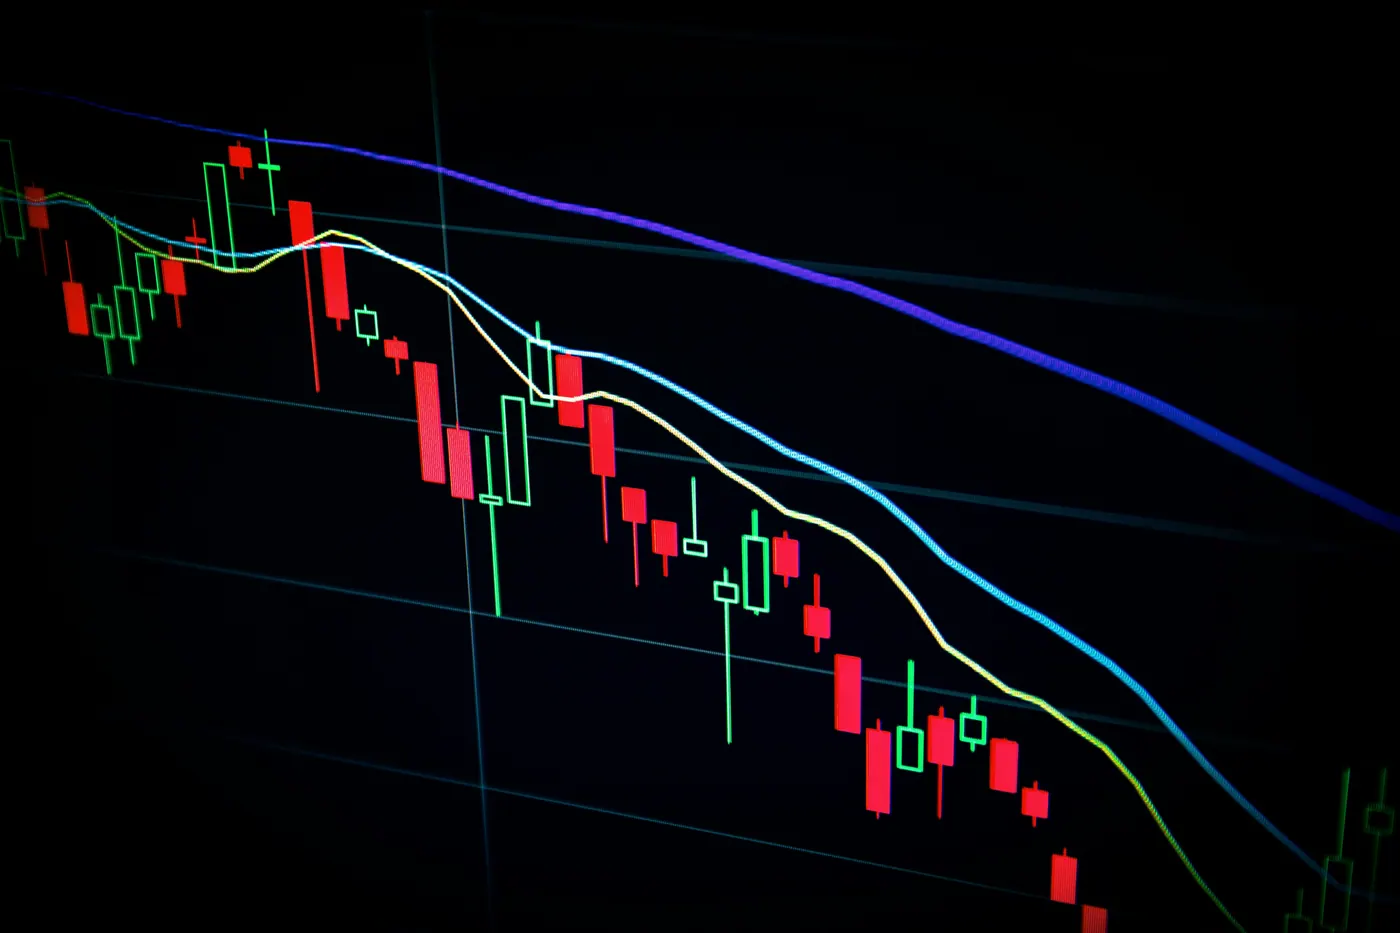
Calling a market bullish or bearish tells you which way prices went. It says nothing about how rough the trip was. Two numbers try to measure that roughness: volatility, which describes one asset on its own, and beta, which describes how that asset moves against the market.
What Volatility Actually Measures
Volatility is the standard deviation of returns. In plain words, it measures how far a return typically lands from its own average.
Take five yearly returns: +10%, -5%, +12%, -3%, +6%. The average is 4%. Each year sits 6, 9, 8, 7 and 2 points away from it. Square those distances so misses above and below both count, average the squares, then take the square root to get back to percentage points. The answer is about 6.8.
So the investment averaged 4% a year, and a typical year landed almost 7 points from that. A savings account paying exactly 4% every year has a volatility of zero. Same average, different experience.
Volatility carries no direction. A stock that gained 30% and one that lost 30% can post identical figures.
Why Volatility Is Almost Always Quoted per Year
Daily volatility is a tiny number and awkward to compare, so convention converts everything to an annual figure. The square root of time rule does it: multiply the daily figure by the square root of the trading days in a year, about 252.
A stock whose daily returns have a standard deviation of 1% lands near 16% annualized, since the square root of 252 is close to 15.9. Monthly to annual means multiplying by the square root of 12.
The square root appears because variances add up over time and standard deviations do not. Two days of independent moves carry twice the variance of one.
That word independent is doing real work. The rule is exact only if each day's move says nothing about the next. Real markets cluster, calm following calm and violent following violent, so annualizing a quiet week overstates how quiet the year will be.
Historical Volatility Versus Implied Volatility
Historical volatility, also called realized volatility, comes from returns that already happened. You pick a window, 30 days or one year or five, and measure. Change the window and you change the answer, which is why two sources can quote different volatility for the same stock and both be right.
Implied volatility runs the other way. An option's price depends on how much movement buyers and sellers expect before it expires, so you can start from the price and work back to the volatility figure that would justify it.
That is not a forecast in the ordinary sense. It is the level at which people are willing to trade, which includes whatever they pay for protection. On index options, implied volatility has tended to sit above the volatility that actually arrives.
What the VIX Measures, and What It Does Not
The VIX is the Cboe Volatility Index. It blends the prices of many out-of-the-money S&P 500 index options across two nearby expirations into one number: expected volatility of that index over the next 30 days, quoted as an annual percentage. The method in use since 2003 relies on no option pricing model, so nothing in it depends on Black-Scholes being right.
Annual quoting is what makes the level confusing. Undo it with the square root of time rule, dividing by the square root of 12, about 3.46. A VIX of 20 prices a one standard deviation move of roughly 5.8% over the coming month.
The nickname fear gauge causes the usual mistake. The VIX does not say prices will fall. It says larger moves are expected, in either direction. It climbs during selloffs because demand for downside protection raises option prices, not because it has predicted anything.
Beta: How Hard a Stock Reacts to the Market
Beta measures how sensitive one asset's return is to the market's. Formally it is the covariance between the two divided by the variance of the market. Informally: when the market moves one point, how many points has this stock typically moved?
A beta of 1 means the stock has moved roughly in step. A beta of 1.5 means that on a day the market rose 2%, this stock averaged about 3%, and on a 2% drop it averaged a 3% fall. A beta of 0.6 means about 1.2% either way. Negative beta means the asset has tended to move opposite the market, which is uncommon among stocks.
These are averages, not rules. The slope says nothing about any particular Tuesday.
Beta Comes From a Regression, and R Squared Says Whether to Trust It
Beta is the slope of a line fitted through a scatter plot of the stock's returns against the market's. That fitting is a regression, and its answer depends on choices that never travel next to the number.
Two matter most. The window: five years of monthly returns and two years of weekly returns give different betas for the same company, and providers pick different conventions. The benchmark: against the S&P 500 a small mining company looks one way, against a materials index, another. There is no such thing as the beta of a stock, only a beta from a stated period against a stated index.
R squared tells you whether the slope means anything. It is the share of the stock's movement that the market explains, from 0 to 1, and here it is the correlation squared. A small single-name stock can come in near 0.1, meaning the market accounts for a tenth of what it does. A beta of 1.4 on an R squared of 0.1 is a slope through a cloud with almost no pattern in it. Still computable, and close to meaningless.
Beta also knows nothing about what a company is becoming. Pay down debt and sensitivity to the market falls almost mechanically. Move from selling hardware to selling subscriptions and earnings behave differently in a downturn. The regression still describes the older company.
What Volatility Treats as Identical
Standard deviation counts a 20% gain and a 20% loss as equal deviations. Nobody experiences them that way. That gap is why downside deviation, which counts only returns below a threshold, and maximum drawdown, the worst peak to trough fall, sit alongside volatility rather than replacing it.
The assumed shape is the deeper problem. Textbook uses treat returns as normally distributed, the bell curve. Real returns have fat tails, so extreme days arrive far more often than that curve allows. On October 19, 1987, the Dow Jones Industrial Average fell 22.6% in a single day. Fit a normal curve to ordinary daily movement and a drop that size prices out as something that should never happen. It happened, and smaller surprises of the same kind happen regularly.
Volatility describes the middle of the distribution well and the edges badly. The edges are where money disappears.
Why High Beta Has Not Reliably Paid More
The Capital Asset Pricing Model, the framework beta comes from, predicts that expected return rises in a straight line with beta. Take more market risk, collect more return.
The evidence has been awkward for over fifty years. Black, Jensen and Scholes found in 1972 that the line was too flat, with low beta stocks doing better than the model said and high beta stocks worse. Fama and French reported in 1992 that beta had little power to explain average returns in their sample, while company size and book-to-market ratio did.
Pointing the other way is the low volatility anomaly: portfolios of lower volatility or lower beta stocks have delivered returns at least comparable to higher beta ones while moving less. Frazzini and Pedersen documented it across asset classes in 2014 and explained it through borrowing limits, arguing that investors who cannot borrow cheaply reach for return by holding high beta assets instead, bidding those prices up and future returns down.
It is documented and still argued over. Competing explanations include pressure on fund managers to beat a benchmark, overlap with profitability measures, and returns that shrink once trading costs are counted. What is not in dispute is that higher beta earning higher returns has failed as a rule.
Bumpiness Is Not the Same Risk as Permanent Loss
Volatility measures how much a value bounces around. It does not measure the chance the money never comes back. Those are separate risks, and one number cannot carry both.
A broad index fund and a single company's stock can post the same volatility while facing very different odds of permanent loss. That kind of loss comes from a business failing, from paying far too much, and from selling at the bottom. None of it appears in a standard deviation.
Over decades, bumpiness matters mainly because of what it makes people do. A 30% drawdown does no lasting damage to a portfolio left alone and still being fed. It does plenty if it stops your contributions, or convinces you to sell and wait for calm, which usually means buying back higher. That is the honest case for reading these numbers: not that they predict anything, but that they tell you what you may have to sit through.