Inflation is one idea. There are several numbers claiming to measure it, and they disagree often enough to change what markets expect the Fed to do.
Two of them come out within a day or two of each other every month, from the same agency. The Consumer Price Index measures what buyers pay. The Producer Price Index measures what sellers receive. Those are not the same question, and the gap between the answers is where most of the useful information sits.
What inflation is and why it happens is covered separately. This is about the measurement, which is where the arguments actually are.
Two Different Questions
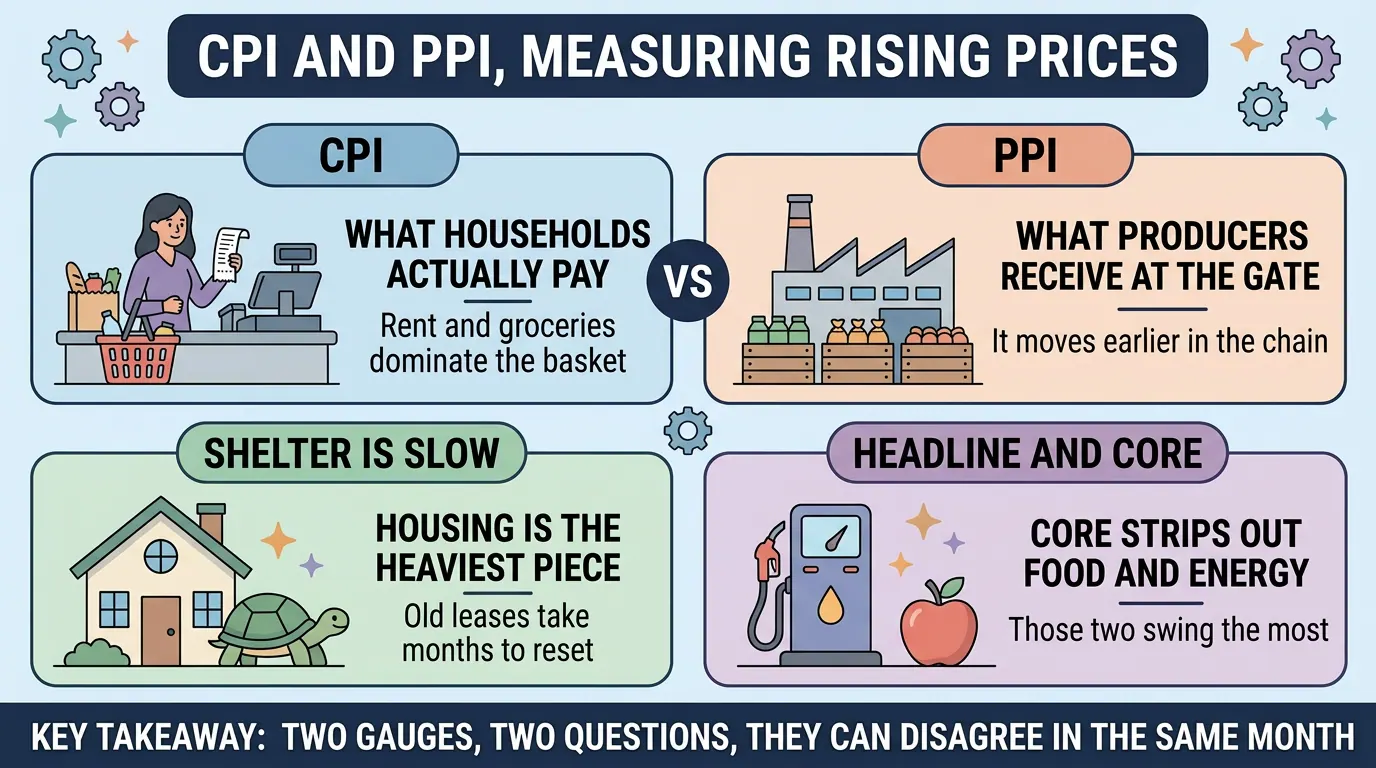
The Consumer Price Index prices a basket of goods and services bought out of pocket by urban consumers. The main published version, CPI-U, covers roughly 93 percent of the US population. Because it follows what consumers buy, it includes imported goods, and it includes sales taxes, since those come out of the buyer's pocket too.
The Producer Price Index measures prices received by domestic producers for their output, at the first commercial transaction. It looks from the seller's side, which flips two things around. Imports are excluded entirely, because a foreign factory is not a domestic producer, and sales taxes are excluded, because the seller never keeps them. PPI also covers services and construction, not just factory goods, which surprises people who assume it is an industrial index.
Why PPI Gets Watched First
PPI captures prices earlier in the chain of production. The Bureau of Labor Statistics organizes it by stage: final demand, meaning output sold to final buyers, and intermediate demand, meaning inputs sold to other businesses. When intermediate demand prices move, the theory is that consumer prices follow some months later.
The link is real but loose. Retail prices absorb wages, rent, transport, and competitive pressure on top of input costs, and a retailer facing weak demand will eat a cost increase rather than lose the sale. Plenty of PPI moves never reach CPI at all. Treat it as one input to a forecast, not the forecast.
Traders watch the release for a more specific reason. Several PPI line items feed directly into the PCE price index the Fed targets, including portfolio management fees, air fares, and pieces of health care. So on PPI day, analysts pull particular series out of the report to estimate what core PCE will print later that month. It is used to nowcast the Fed's preferred gauge more than to predict CPI.
Shelter, the Heaviest and Slowest Part of CPI
Shelter is about a third of CPI-U. It splits into rent of primary residence, around 8 percent of the index, and owners' equivalent rent, which on its own is close to a quarter of the entire basket. Nothing else comes near that weight.
Owners' equivalent rent, or OER, is the BLS estimate of what a homeowner would pay to rent their own home. People find this strange, and the reason for it is worth knowing. CPI measures consumption, and buying a house is mostly an asset purchase, closer to buying a bond than to buying groceries. What a homeowner consumes each month is the shelter service the house provides, and estimating that with rents on comparable units is the standard approach across national statistical agencies.
It lags for two mechanical reasons. Leases mostly reset once a year, so at any moment most units in the sample carry a price set months ago. And BLS surveys each housing unit about twice a year, so even a completed change takes time to enter the index. Market rent measures built from new listings turned roughly a year ahead of CPI shelter during 2021 to 2023.
The consequence matters. When people said core inflation was stuck in 2023 and 2024, a large share of what they were looking at was shelter still catching up to rent increases that had already stopped. Watching CPI excluding shelter is the common adjustment, though it has its own problem: housing costs are real, and dropping them out flatters the number.
Headline and Core
Headline CPI includes everything in the basket. Core CPI strips out food and energy.
This is not a claim that food and energy do not matter. They are the prices people notice fastest, and for lower-income households they take the biggest bite. They get removed because they swing on weather, harvests, and geopolitics rather than on domestic demand, and because those swings tend to reverse. A hurricane can move headline CPI for a month and tell you nothing about where prices are heading.
Other measures attack the same problem differently. The Cleveland Fed publishes median CPI and trimmed-mean CPI, which discard the largest movers in both directions each month regardless of category. That sidesteps the objection that food and energy are excluded by convention rather than by evidence.
Month Over Month, Year Over Year, and Base Effects
The figure reported in the news is usually the 12-month change. That number is the accumulated product of the last twelve monthly changes, which means eleven twelfths of it is history.
So it moves for two separate reasons: what happened this month, and what fell out of the window from a year ago. The second is called a base effect. If the month rolling off printed 0.9 percent and the new month prints 0.2 percent, the annual rate drops about 0.7 points on arithmetic alone, with nothing new happening in the economy. Commentary that treats such a drop as fresh progress has misread the calendar.
Monthly changes have the opposite problem. They are noisy, subject to revision, and one print says little. A common compromise is the three-month or six-month annualized rate, which shows recent momentum without carrying a year of stale history. One convention to watch: monthly changes are normally quoted seasonally adjusted, while 12-month changes usually are not, since seasonality washes out over a full year.
The Standard Criticisms
Substitution bias comes first. A fixed basket assumes people keep buying the same things when relative prices change. In reality, when beef gets expensive, households buy more chicken. Holding the basket rigid overstates what it costs to maintain a given standard of living.
BLS addressed part of this in 1999 by using geometric means within item categories, which allows for switching between close substitutes such as two brands of coffee. Switching across categories, coffee to tea, is still not captured in CPI-U. A separate index, the Chained CPI, does capture it, and it typically runs a couple of tenths of a point per year below CPI-U. Since 2018 the chained version has been what the IRS uses to index tax brackets, a concrete case of the choice of index moving real money.
Hedonic adjustment is the harder criticism. When the product itself changes, is a price change still a price change? A $1,000 laptop replaced by a $1,000 laptop with twice the memory and a better screen is arguably cheaper per unit of laptop. BLS runs statistical regressions on product features to separate the quality improvement from the price movement.
The objections run both ways. Some argue this understates inflation, because you cannot go buy the older cheaper model and the improvement was not one you asked for. Others argue that without it, technology would appear to be getting more expensive when it obviously is not. Worth knowing the scale before joining either side: hedonic methods apply to a minority of the index, concentrated in apparel, electronics, and vehicles, so the effect on the headline is smaller than the volume of argument implies.
The historical benchmark for all of this is the Boskin Commission, which concluded in 1996 that CPI overstated the cost of living by roughly 1.1 percentage points a year. BLS has changed several methods since, and current estimates of any remaining bias are much smaller and still disputed.
Where PCE Fits
The Fed's 2 percent target is written in terms of the PCE price index rather than CPI, which the inflation article covers in more detail. The short version: PCE comes from the Bureau of Economic Analysis, it updates its weights every month so substitution is captured automatically, and it counts spending made on your behalf, most importantly employer-paid and government-paid health care. That gives medical care a much larger weight in PCE and shelter a much smaller one, PCE has often run a few tenths of a point below CPI as a result, though the gap can narrow or flip depending on what is driving prices in a given stretch. In mid-2026, for instance, core PCE was running above core CPI.
Summary
CPI prices what consumers pay including imports and sales taxes, while PPI prices what domestic producers receive, excluding both. PPI leads sometimes and is watched partly because it feeds the Fed's preferred index. Shelter dominates CPI and moves late, which distorts readings for months at a time. Core strips volatile food and energy to expose the trend, annual figures carry base effects from a year ago, and the long-running complaints about substitution and quality adjustment are real methodological questions rather than accusations of dishonesty.