The Fed cut rates and my mortgage quote went up. People say some version of this every year, and they are not misremembering. They just assumed the Fed sets mortgage rates. It does not.
The 30-year fixed mortgage takes its cue from a different number, and once you know which one, most of the strange behavior in the housing market becomes readable.
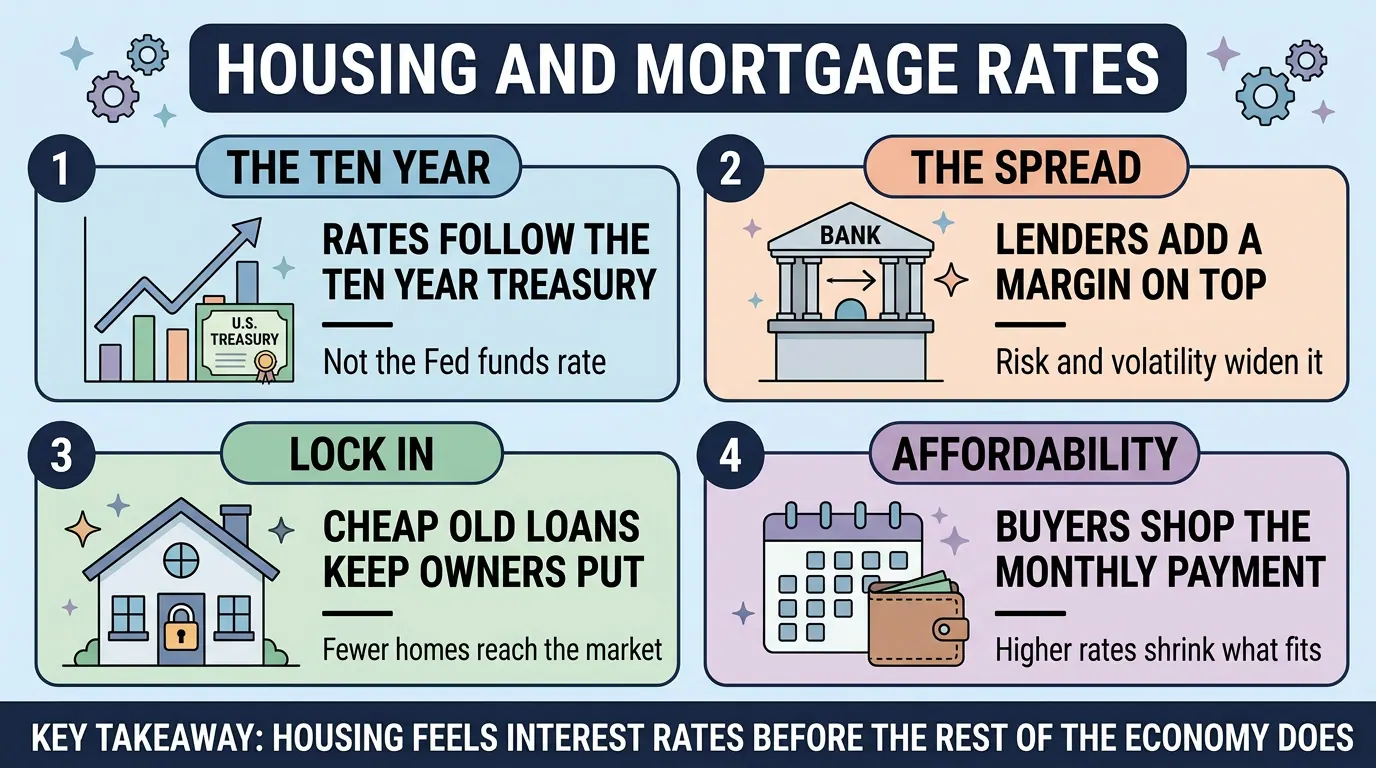
Why the 10-Year Treasury, Not the Fed Funds Rate
The federal funds rate is an overnight rate. Banks lend reserves to each other for one night at a time, and the Fed sets a target range for that price. A 30-year mortgage is a commitment measured in decades. They are not comparable products, so they do not price off each other directly.
The comparison the market actually makes is with the 10-year Treasury note, and the reason is expected life rather than stated term. Most 30-year mortgages do not last 30 years, because people move or refinance, so the average loan is repaid in something closer to seven to ten years. That puts a mortgage in roughly the same duration neighborhood as a 10-year Treasury, and duration is what bond investors price.
The plumbing runs through the secondary market. Lenders rarely keep the loans they write. They sell most conforming mortgages to Fannie Mae or Freddie Mac, which bundle them into mortgage-backed securities and sell those to investors. Those investors are choosing between a mortgage security and a Treasury of similar duration, so the rate you get quoted is built off the Treasury yield plus a premium.
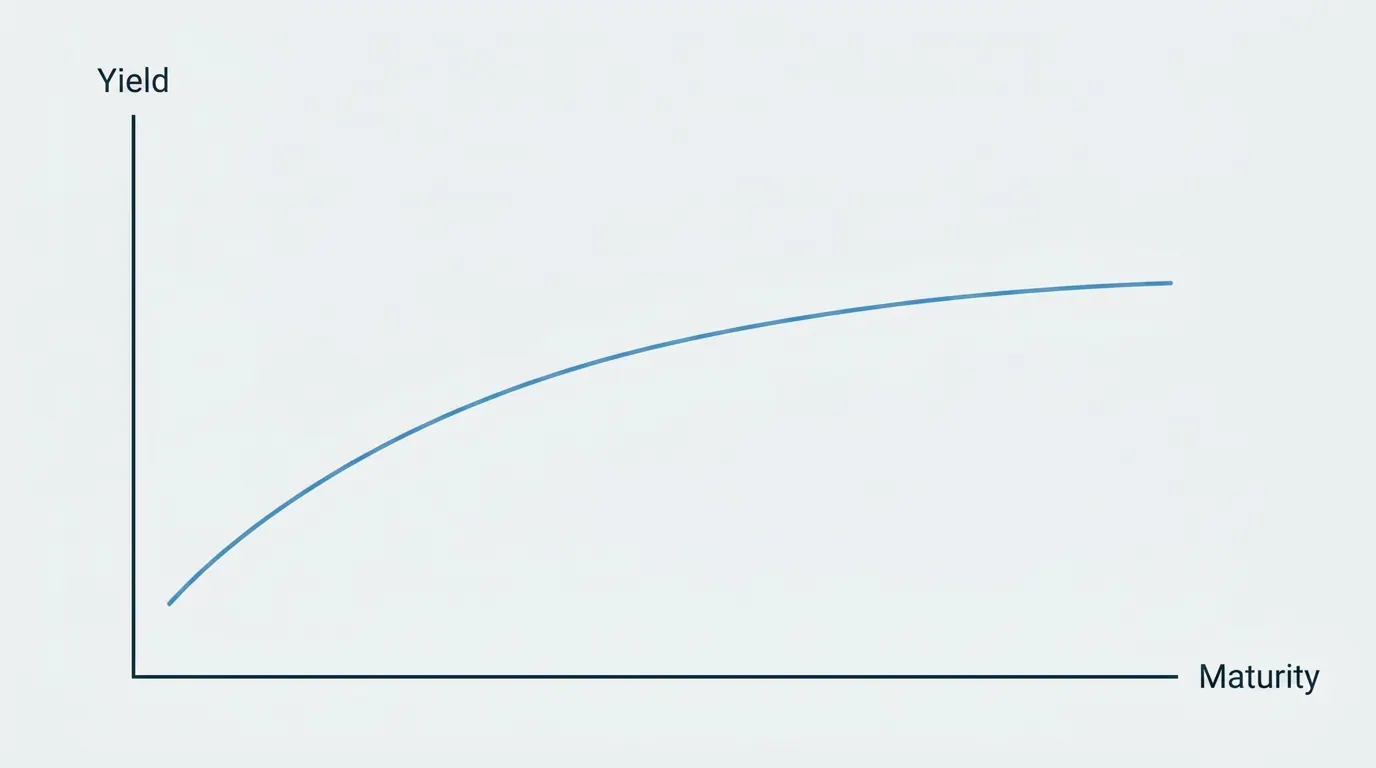
The Fed still matters, just indirectly. Its decisions and its guidance about future decisions move the whole yield curve, the 10-year included. But the 10-year also responds to inflation expectations, to how much new debt the Treasury is issuing, and to foreign appetite for dollar assets. The Fed can cut the overnight rate while the 10-year climbs, and that is exactly when mortgage rates go the wrong way after a cut.
The Spread and What Widens It
The gap between the average 30-year mortgage rate and the 10-year Treasury yield has run roughly 1.7 to 1.8 percentage points since the end of the last financial crisis. In early August 2026 it sat closer to 2 points, with the 10-year near 4.65 percent and the average 30-year fixed rate near 6.69 percent. A wider spread means borrowers pay more even when Treasury yields have not moved at all.
The main thing that widens it is the prepayment option. Every American mortgage borrower can refinance whenever they like with no penalty. When rates fall, borrowers refinance and the investor's high-yielding bond disappears, forcing reinvestment at lower rates. When rates rise, borrowers stay put and the investor is stuck holding a below-market bond for longer than expected. The investor loses on both ends, so they demand extra yield for accepting that risk. The more uncertain the path of rates looks, the more that option is worth to the borrower and the more compensation the investor requires.
Other things push the spread out:
Fewer buyers for mortgage-backed securities. The Fed was an enormous buyer during its bond purchase programs and has stopped, and banks trimmed their holdings after the 2023 regional bank failures made large long-duration portfolios look risky.
Expected credit and servicing costs, which rise when lenders anticipate more late payments and foreclosures.
Lender capacity. When origination volume collapses, fixed costs get spread across fewer loans.
The Lock-In Effect
Millions of American households refinanced into mortgages at or below 3 percent during 2020 and 2021. That loan is an asset in its own right. Selling the house means surrendering it and taking on a new loan at today's rate, on a house that probably costs more than the one being left.
So owners stop selling. In a 2026 survey, roughly three quarters of mortgaged homeowners still held a rate under 6 percent, and about half said they would not sell until rates dropped below 5 percent. Existing homes make up most of what is available to buy, so when owners refuse to list, inventory dries up.
This explains a combination that otherwise looks impossible. Sales volume falls hard because buyers cannot carry the payment, and prices barely fall because there is almost nothing to buy. Weak demand normally drags prices down. It did not here, because supply contracted alongside demand.
The lock-in loosens slowly as more of the outstanding mortgage stock gets written at current rates. By the end of 2025, about a fifth of outstanding mortgages carried rates above 6 percent, the highest share in roughly a decade. Every year, more households have nothing left to lose by moving.
Affordability Is a Payment, Not a Price
Buyers do not shop for a price. They shop for a monthly payment their income can carry, and the interest rate decides how much house that payment buys.
Take a $400,000 loan. At 3 percent, principal and interest run about $1,686 a month. At 6.7 percent, the same loan costs about $2,581. The house did not change. The payment went up 53 percent.
Run it the other direction and it gets starker. If your budget is that $1,686 payment and rates are 6.7 percent, the loan you can carry is about $261,000. The rate move cut your buying power by roughly 35 percent without a single listing price changing.
This is why home prices and mortgage rates do not move in a clean opposite pattern. Higher rates crush what buyers can pay, which pushes prices down, while the lock-in effect chokes off supply, which pushes them up. Which force wins varies by metro area and by year.
Starts and Permits as an Early Signal
Two housing numbers get watched as leading indicators for the whole economy. Building permits are authorizations issued by local governments before construction can begin. Housing starts are foundations actually broken. Both come out monthly from the Census Bureau, with permits earlier in the sequence.
They lead because homebuilding takes months and builders have to commit money against demand they expect rather than demand they can see. A builder who thinks buyers are vanishing stops pulling permits right away, long before completions or closed sales show anything. Building permits are one component of the Conference Board's Leading Economic Index for exactly this reason.
The economist Edward Leamer made the strong version of the argument in a 2007 paper titled Housing IS the Business Cycle, noting that residential investment turned down ahead of most postwar US recessions. The relationship is not perfect and it has broken in individual episodes, but the pattern is one of the more durable regularities in American macroeconomics.
Why Housing Feels Rates First
Several things stack up. A home purchase is almost entirely debt-financed, so the rate is not a detail on the side, it is most of the cost. The loan is long, which magnifies what a one-point change does to the monthly payment. And residential construction employs a lot of people while pulling a long supply chain behind it, from lumber and appliances to title agents, appraisers, and movers.
So when the Fed tightens, housing is where the effect surfaces first and most visibly, often months before it reaches the broader labor market. When the Fed eases, housing usually leads the recovery for the same reasons.
Summary
Mortgage rates track the 10-year Treasury yield plus a spread, not the Fed's overnight rate, which is why Fed decisions reach your quote only indirectly. That spread widens when rate volatility makes the borrower's free refinancing option more valuable and when demand for mortgage bonds thins. Owners holding 3 percent loans stopped listing, cutting supply enough to hold prices up even as sales collapsed. Affordability is a payment rather than a price, so a few points of rate can erase a third of a buyer's purchasing power.